Create powerful dashboards with Azure Workbooks
Intro
What value brings maintenance if we do not monitor its results?
In this post I will show you how you can easily create Azure workbook with data from Log analytics. 📊
The data we will take a look at are generated by runbook from this post - Verify Azure AD Bitlocker Keys with Microsoft Graph.
One last thing…I’ve updated code in that post to provide more useful data and seamless compliance with log analytics.
Log analytics
Log Analytics is a tool in the Azure portal to edit and run log queries from data collected by Azure Monitor Logs and interactively analyze their results.
You can use Log Analytics queries to retrieve records matching particular criteria, identify trends, analyze patterns, and provide a variety of insights into your data.
To be able to understand and create your own queries you will need to get familiar with Kusto query language (KQL).
For that and more visit - Log Analytics tutorial.
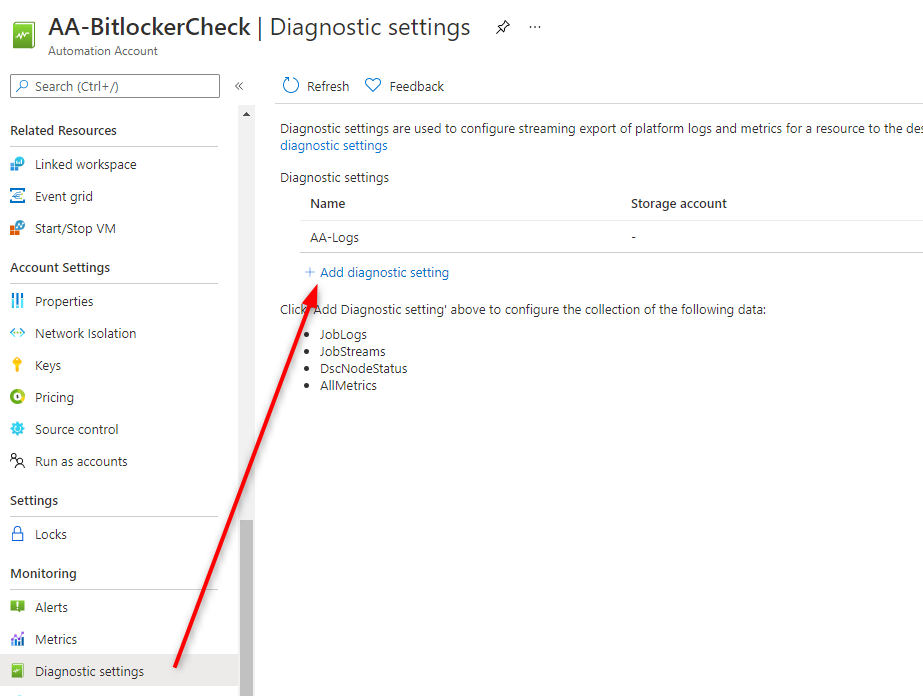
The fastest way to read outputs from your runbooks is to enable diagnostic settings. Navigate to your automation account and proceed with adding new diagnostic settings:
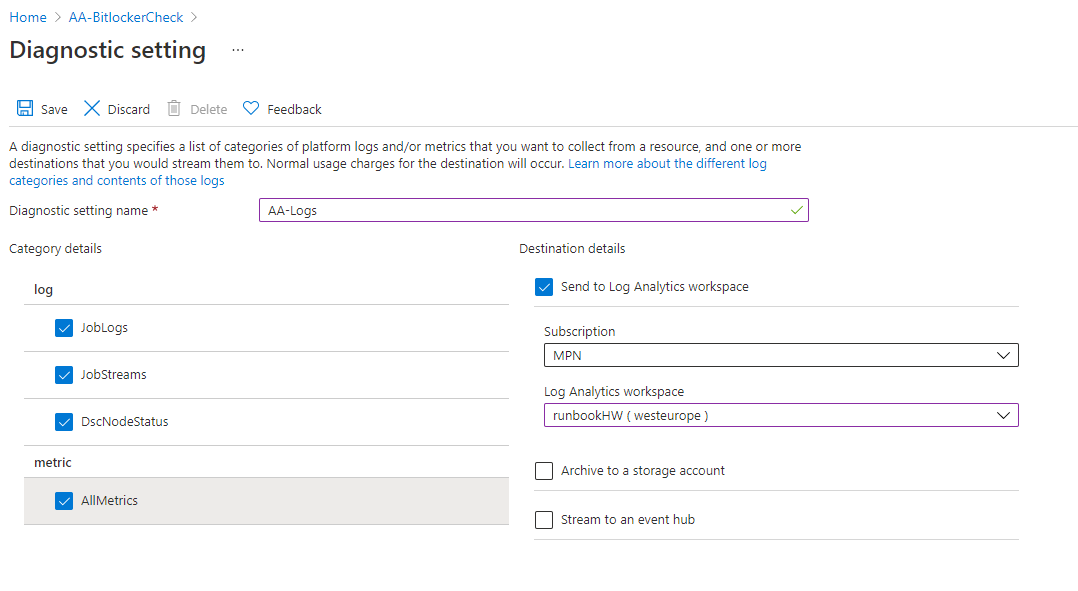
Then, enter name for your setting and choose log analytics workspace:
Sending and processing data for the first time might take some time so go grab a cup of your favorite drink 😉 When ready, navigate to your logs workspace and try to run that simple query:
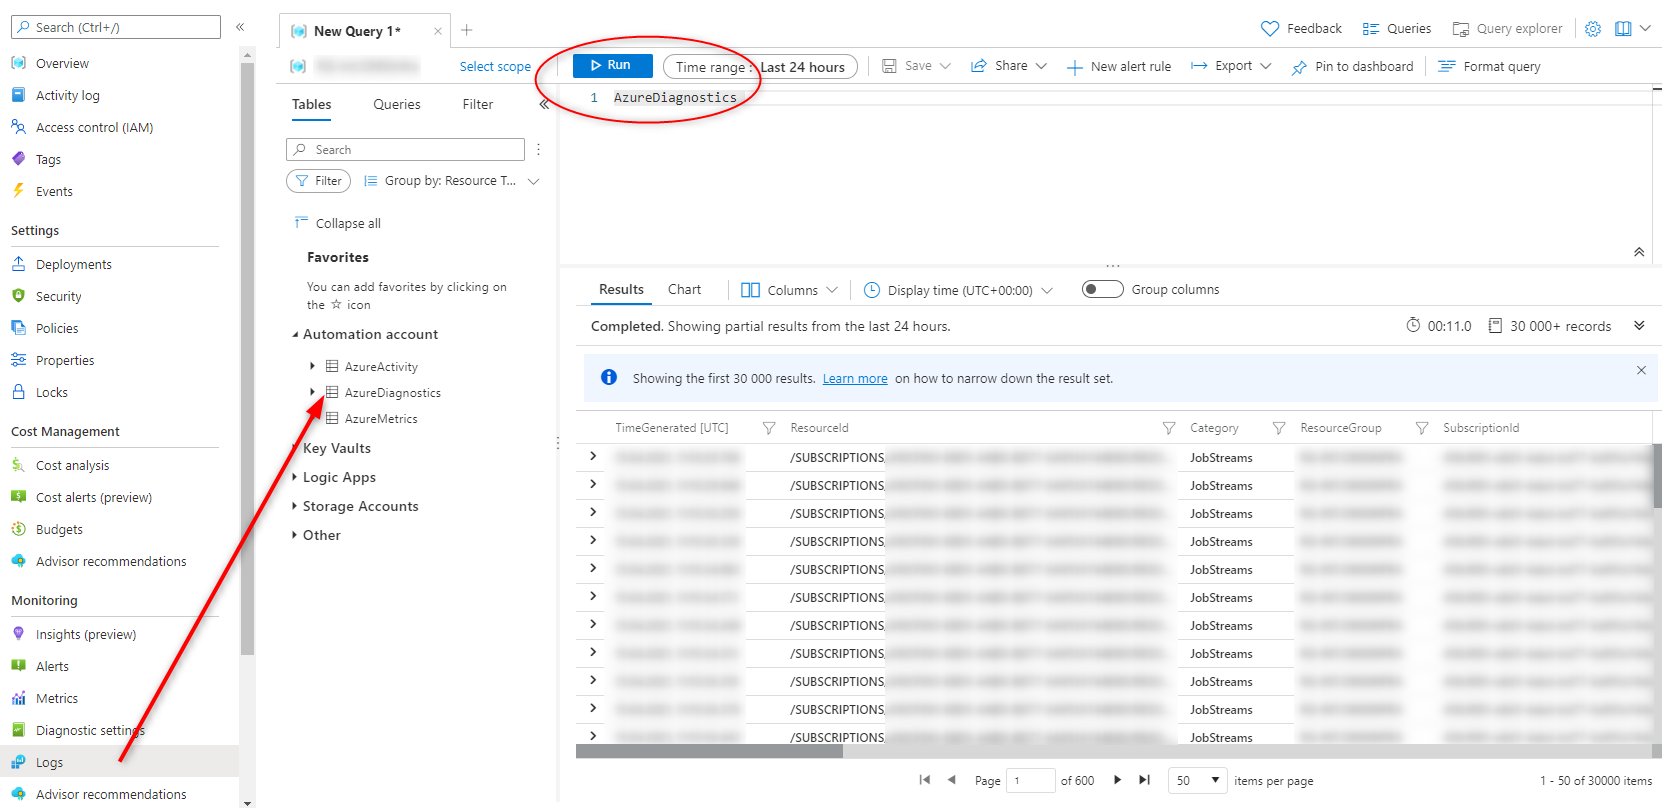
If you see data it means that you can proceed with expanding your query! Logs contain data generated by all your runbooks within automation account connected to this workspace. Firstly you will need to filter through runbookname and then category because we are interested only in script output
AzureDiagnostics
| where RunbookName_s == "BitlockerRecoveryKeysMaintenance"
| where Category == "JobStreams"
Raw output has a lots of currently unnecessary data and the good stuff is wrapped in JSON in column ResultDescription. Expand this JSON and show only columns that I want ✨:
| extend DeviceName = tostring(parse_json(ResultDescription).DeviceName)
| extend ReferenceId = tostring(parse_json(ResultDescription).DeviceId)
| extend RecoveryKeyInAAD = tostring(parse_json(ResultDescription).RecoveryKeyInAAD)
| extend Action = tostring(parse_json(ResultDescription).Action)
| extend AdditionalInfo = tostring(parse_json(ResultDescription).AdditionalInfo)
| project DeviceName,UserName,RecoveryKeyInAAD,Action,AdditionalInfo,AADDeviceId = ReferenceId,DeviceId,TimeGenerated
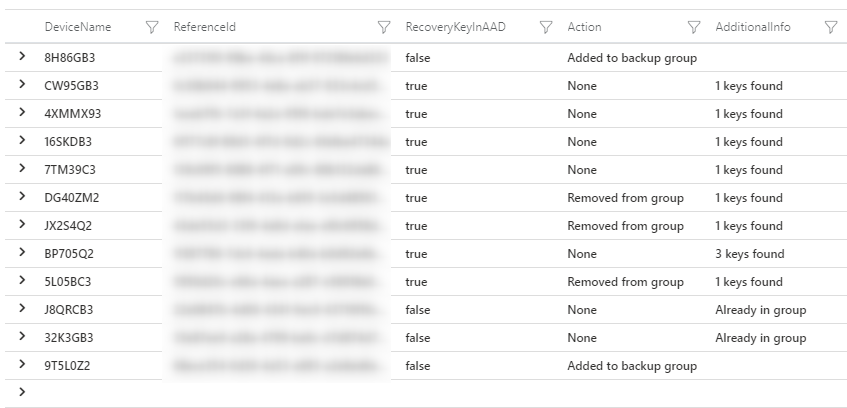
With those simple steps you have got nicely formatted table with results of maintenance task:
Azure workbook
Opening log analytics every time and paste some query to analyse data is not for me…thankfully you can create workbook which will allow you to see that data instantaneously and do much more!
Go to Azure Monitor, then Workbooks:
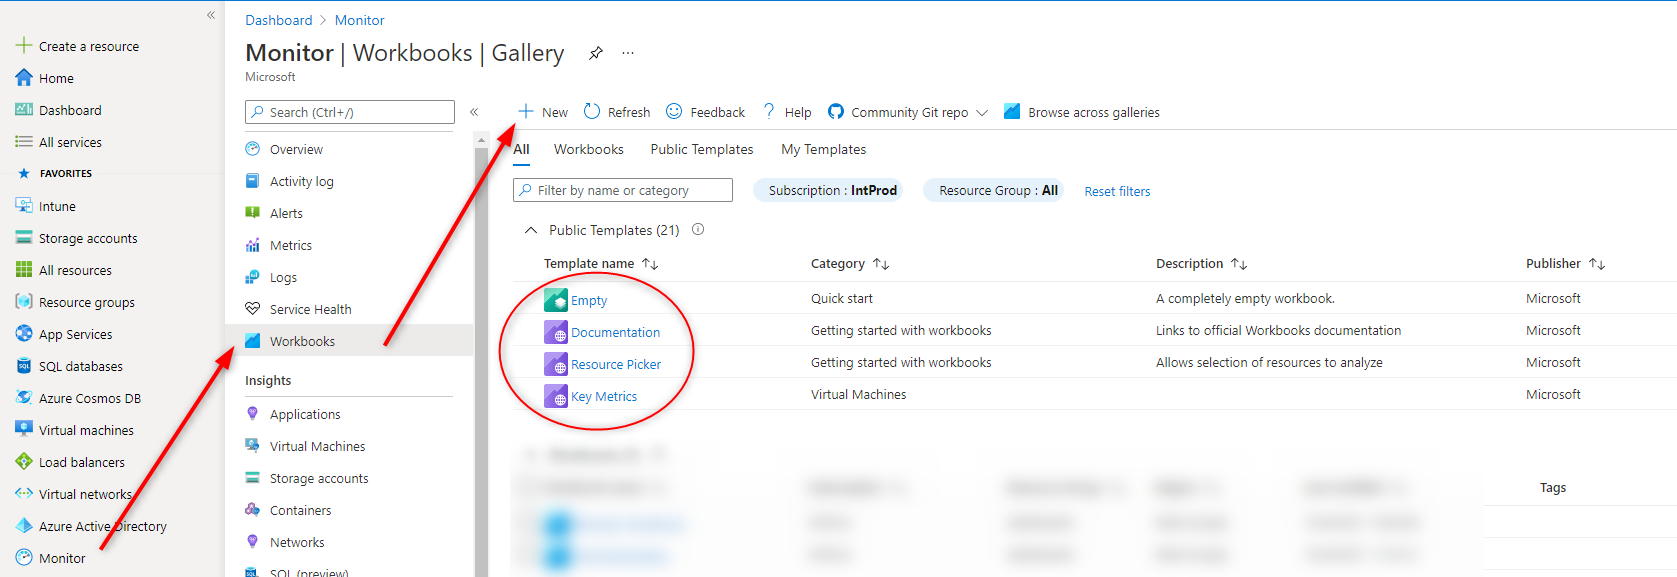
There you will find some templates and you can also browse gallery or search through community github repo. This helps a lot at the beginning 😉 When ready create a new workbook!
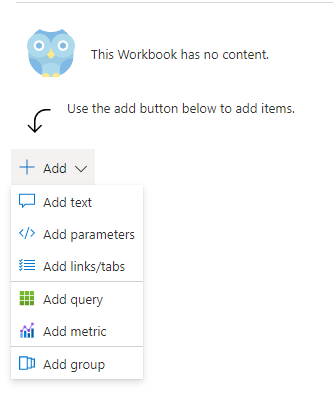
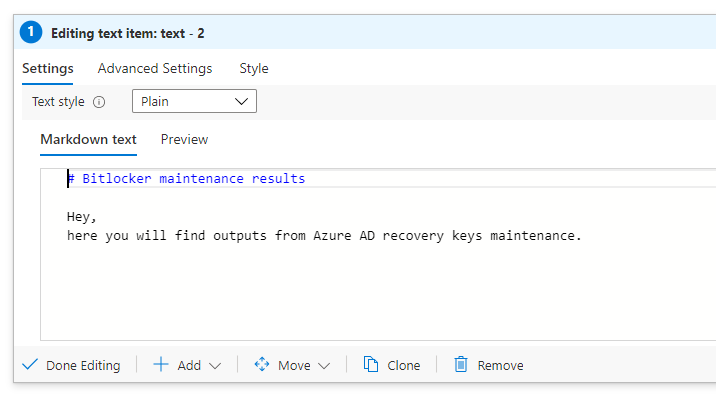
You can start with providing some description
Next, add parameter section. It allows you to easily manipulate data and visualizations that are presented in your report.
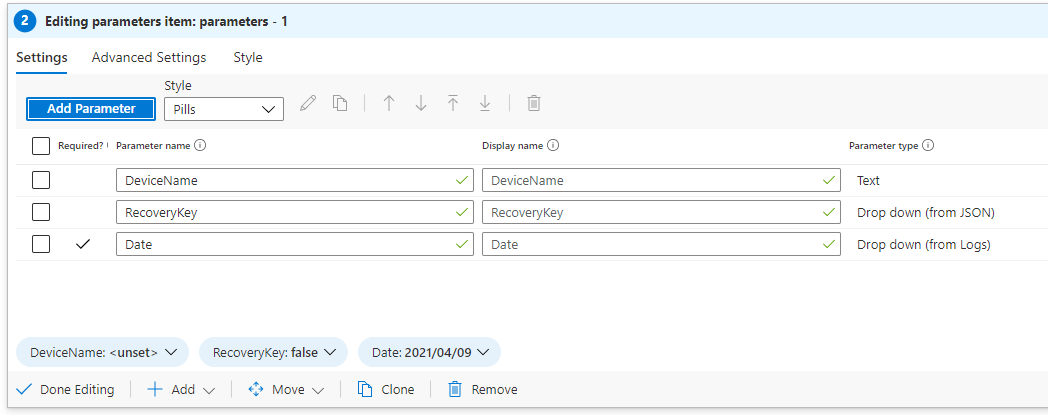
Parameters can take many different types, for this report you will need:
- textbox - for searching string
- dropdown (JSON) - for filtering true/false values
- dropdown (KQL) - for filtering dates of maintenance if they are custom
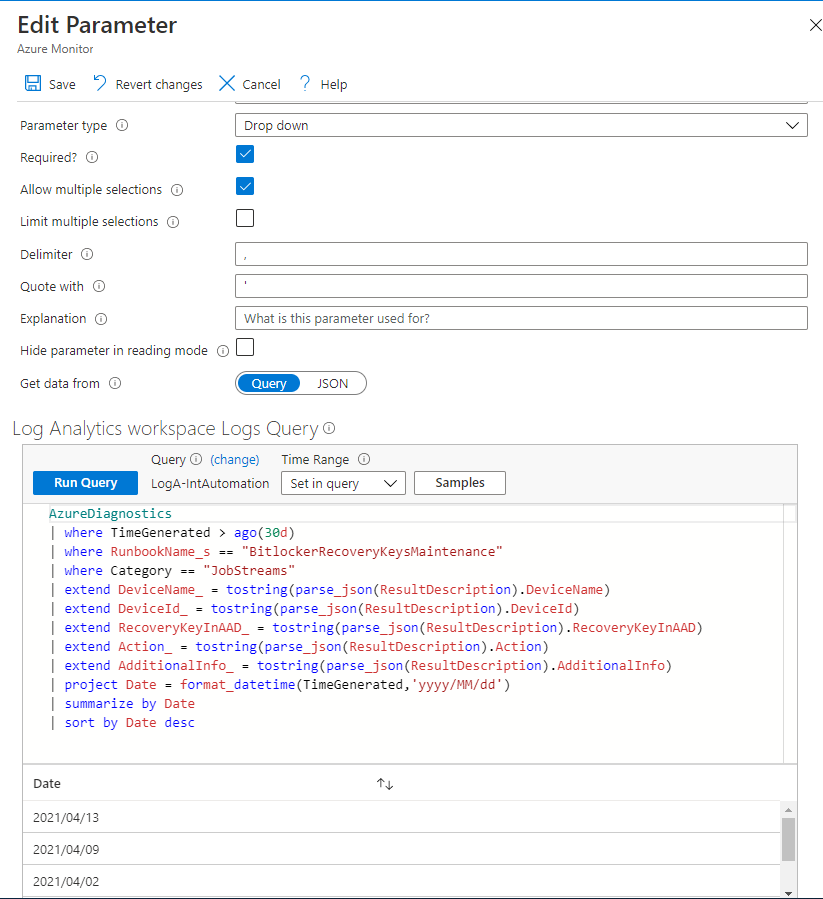
While first two are rather simple the last one might be tricky. Here take a look how it can be done:
AzureDiagnostics
| where TimeGenerated > ago(30d)
| where RunbookName_s == "BitlockerRecoveryKeysMaintenance"
| where Category == "JobStreams"
| extend DeviceName_ = tostring(parse_json(ResultDescription).DeviceName)
| extend DeviceId_ = tostring(parse_json(ResultDescription).DeviceId)
| extend RecoveryKeyInAAD_ = tostring(parse_json(ResultDescription).RecoveryKeyInAAD)
| extend Action_ = tostring(parse_json(ResultDescription).Action)
| extend AdditionalInfo_ = tostring(parse_json(ResultDescription).AdditionalInfo)
| project Date = format_datetime(TimeGenerated,'yyyy/MM/dd')
| summarize by Date
| sort by Date desc
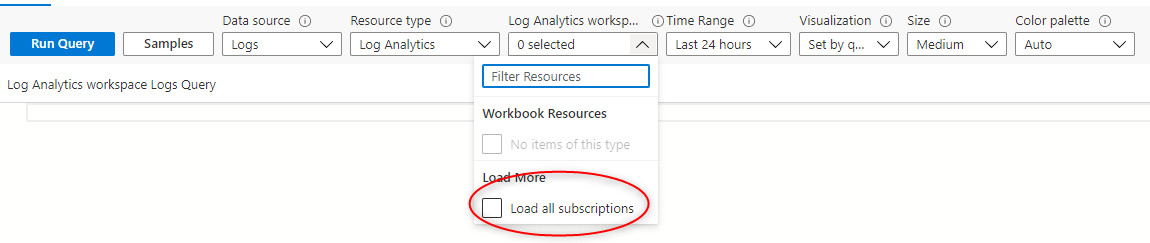
Now you can create query section and use KQL from previous paragraph to search for maintenance results. Remember to choose correct workspace as source point of your data!
Query:
AzureDiagnostics
| where format_datetime(TimeGenerated,'yyyy/MM/dd') in ({Date})
| where RunbookName_s == "BitlockerRecoveryKeysMaintenance"
| where Category == "JobStreams"
| extend DeviceName = tostring(parse_json(ResultDescription).DeviceName)
| extend ReferenceId = tostring(parse_json(ResultDescription).DeviceId)
| extend RecoveryKeyInAAD = tostring(parse_json(ResultDescription).RecoveryKeyInAAD)
| extend Action = tostring(parse_json(ResultDescription).Action)
| extend AdditionalInfo = tostring(parse_json(ResultDescription).AdditionalInfo)
| join IntuneDevices on ReferenceId
| project DeviceName,UserName,RecoveryKeyInAAD,Action,AdditionalInfo,AADDeviceId = ReferenceId,DeviceId,TimeGenerated
| where DeviceName startswith "{DeviceName}" and RecoveryKeyInAAD in ({RecoveryKey})
| distinct *
NOTICE that using parameters in KQL query is as simple as providing paramter name in {Name}
In query above I’m also loading data from log analytics containing details fetched from Intune Data Warehouse.
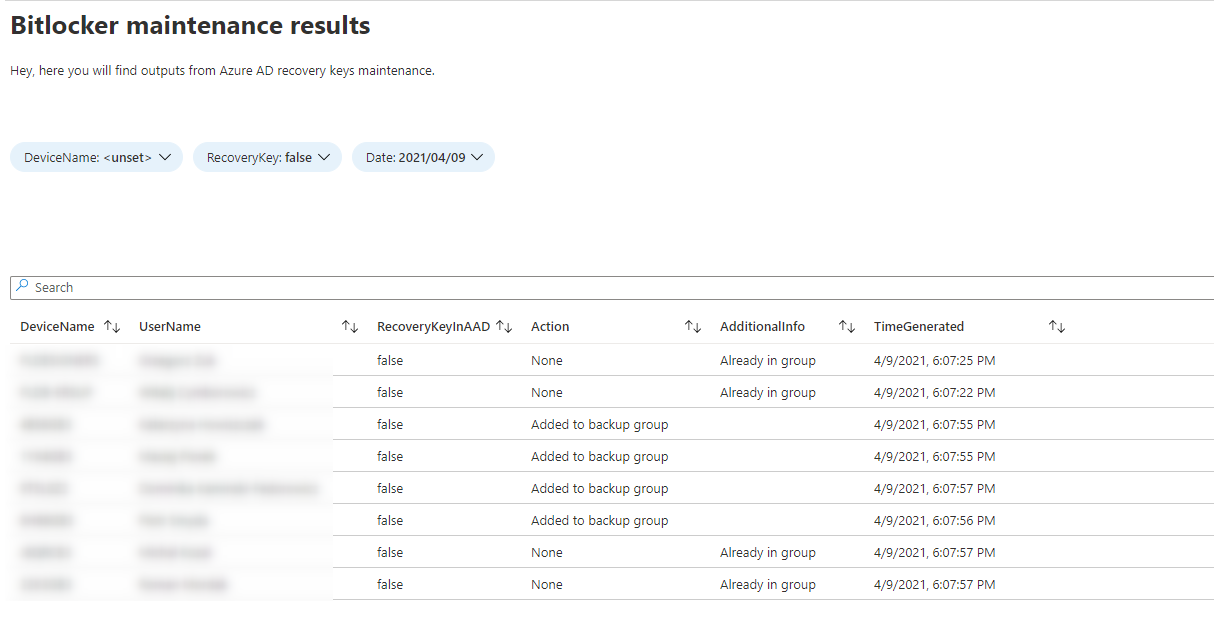
You should be able to see results in form of table:
Another great feature of azure workbooks is that you can create actions within report!
Lets say that you want to select device on a list and take a quick look on it in Intune console.
YES YOU CAN 😁
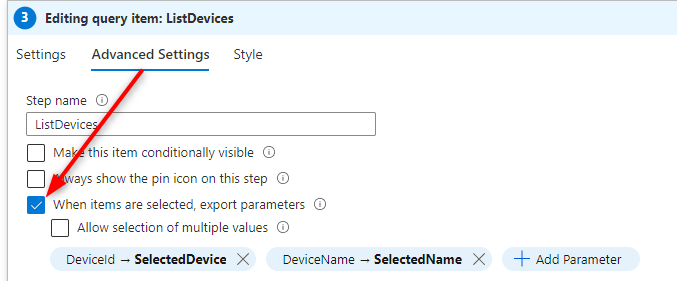
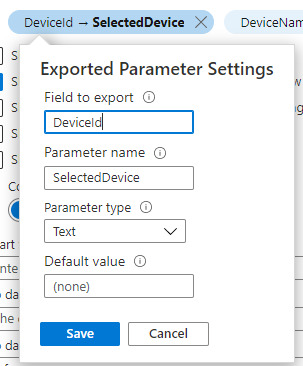
Start with modifying query section to allow it to export data as parameters:
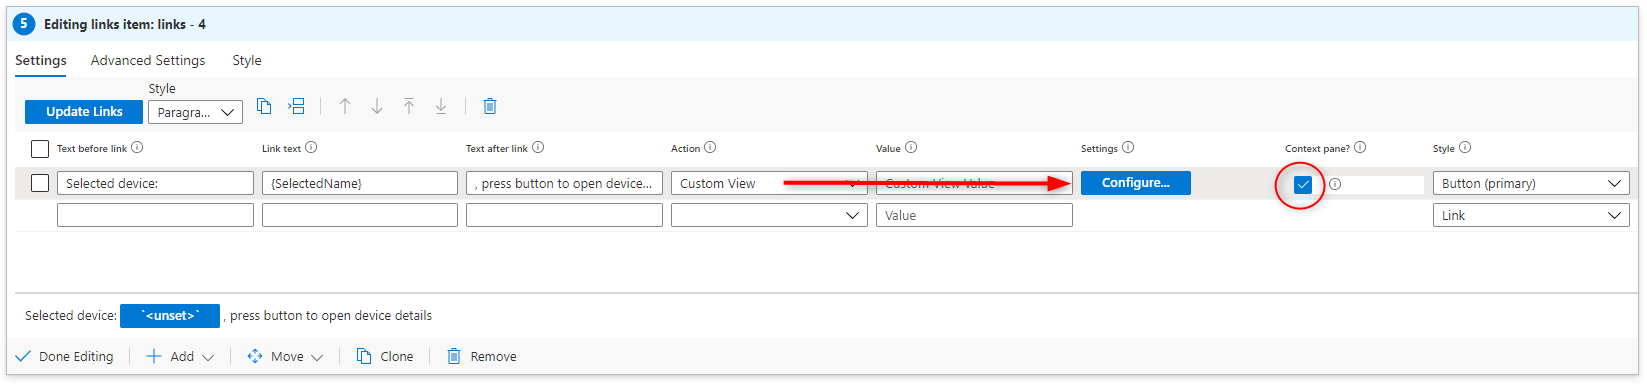
Now, create a new section of type links/tabs, select action custom view and tick context pane box:
In configuration pane for custom view choose url and pase this
https://portal.azure.com/#blade/Microsoft_Intune_Devices/DeviceSettingsBlade/overview/mdmDeviceId/
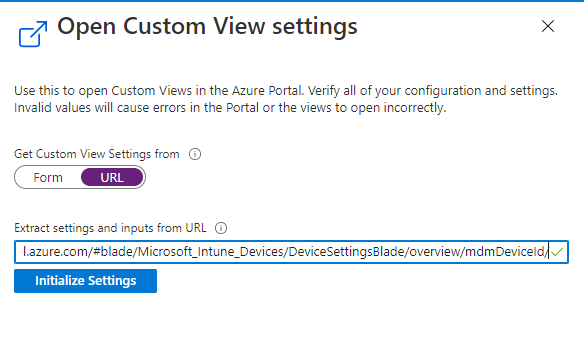
After you click initialize your view should look like that:
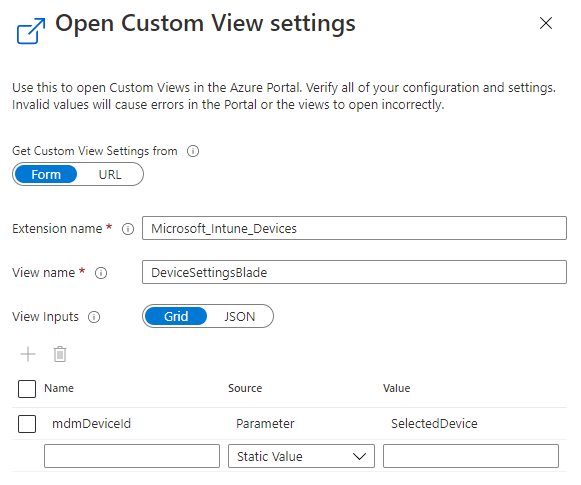
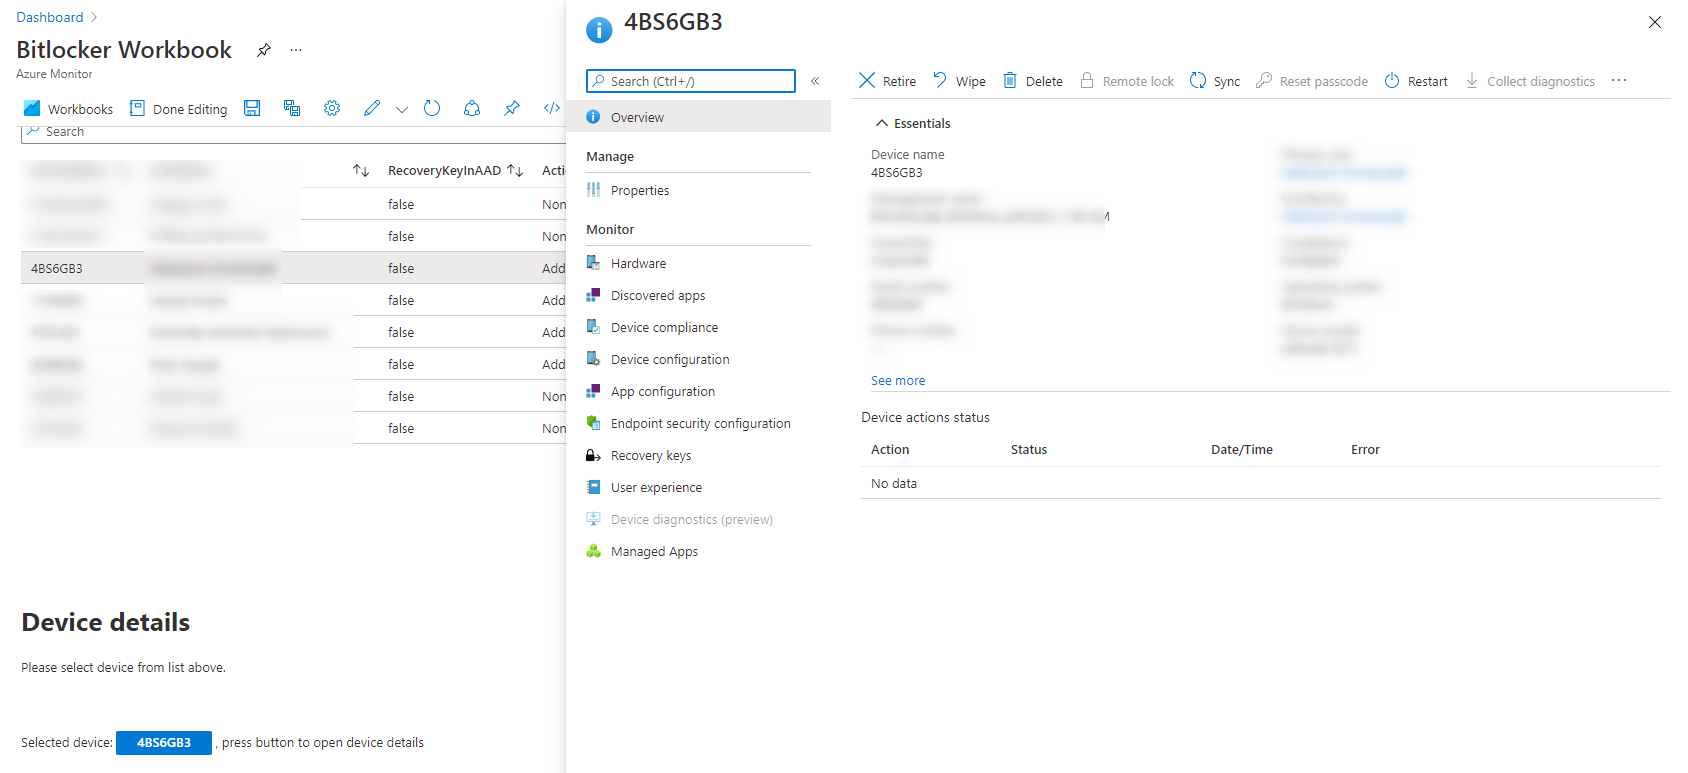
And when you select device from list you will be able to invoke button action that will open device details 🥳:
Summary
Right now Azure workbooks are my favorite tool to play with data visualization and drawing a conclusions based on what I see.
I will probably end up with whole dashboard build from workbooks!!
See you in next! 😉 🧠